Experimental Data
Comparing laboratory wave–tank experiments with the modified growth rate
Note: This comparison does not appear in the preprint and is not in its final form as it was made in response to reviewer comments and the manuscript is still under revision.
Comparing to experimental data reveals that the observed suppression of wave growth with increasing wave steepness closely corresponds to the predicted growth rates from our mathematical analysis. Wave–tank experiments report a reduction in growth as the waves become steeper; our modified Miles growth rate captures this behavior naturally through the $\epsilon^2$ correction term.
To make the comparison shown below, it was necessary to extend Miles’ growth-rate approximation in the case of a realistic logarithmic background profile, which is neither analytically nor numerically tractable , unlike the double–exponential profile. Using the calculated growth-rate modification, we construct a corrected growth curve given a background logarithmic wind profile and compare it to the growth rates inferred from the compilation of laboratory studies in Peirson & Garcia (2008).
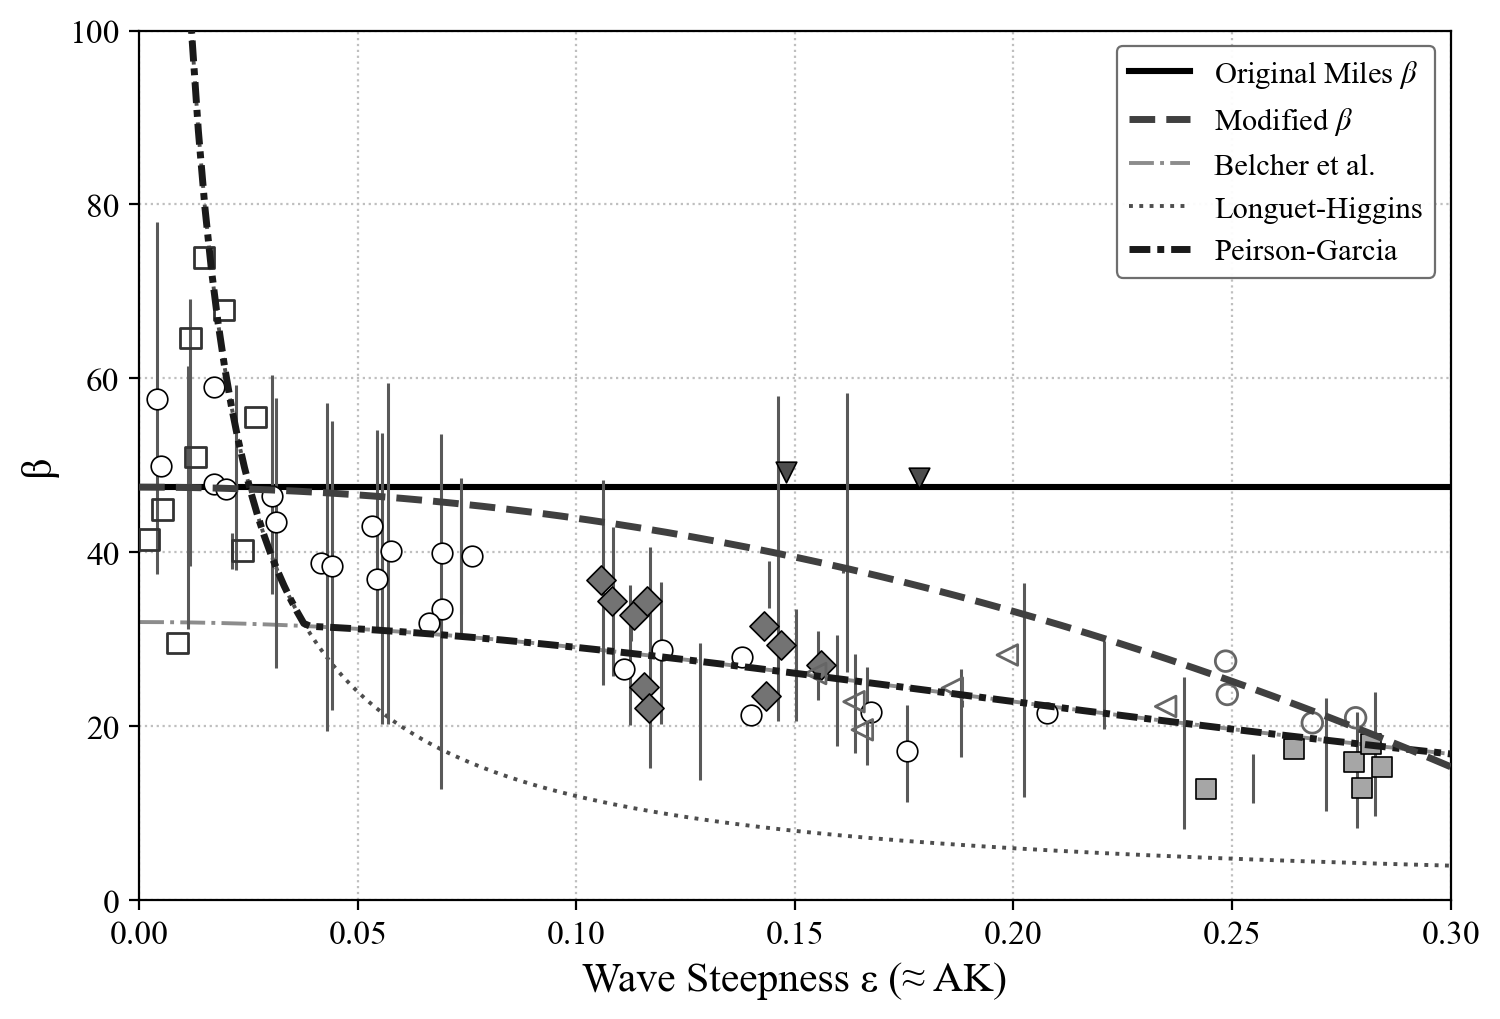
The solid black line is the original Miles growth rate for a logarithmic wind profile, which does not depend on wave steepness.
The dashed line represents the modified growth rates we calculated including the $\epsilon^2$ correction. Here, a long wave frequency of $f = 3$ Hz was assumed as that was an intermediate frequency among those used in the experiments. The aerodynamic roughness length was set to $y_0 = 0.001$ m and the friction velocity $u_*$ was set to $0.33$ m/s, which were values within the typical range of the experiments. One could likely get a better fit to the data by adjusting the choice of these parameters on the basis of individual experiments, rather than just picking constant values within the ranges used in the experiments, but the purpose here is to demonstrate that the trend of decreasing growth with increasing steepness is captured by our modification. The von Kármán constant $\kappa$ was taken as $0.4$.
The dash-dotted, dotted, and dashed lines are from Peirson & Garcia (2008) and represent the possible theoretical predictions for the data given therein. Note that this explanation is partially empirically fitted in that the Belcher line was fitted using a combination of Belcher (1999)'s formula for the energy input to the wave field by wind and "attributing 37.5 % of the Plant growth rate to the wave coherent tangential stress (to best represent the overall data trend at higher steepnesses)."